Principle of operation of a calculation module
Each Cassiopée calculation module allows you to calculate a parameter of your choice from those in one or more equations.
Open a new calculation module

The list of modules is available when the application is launched. After opening a new calculation module, this list is available via the "+" button located in the upper banner or via the "☰" menu and then the "New calculation module" link located in the menu.
The list of open modules appears in the upper banner and allows you to navigate between open modules.
How are the choices made to perform a calculation or a series of calculations ?
The module is presented as a series of parameters involved in solving the equation of the calculation module.
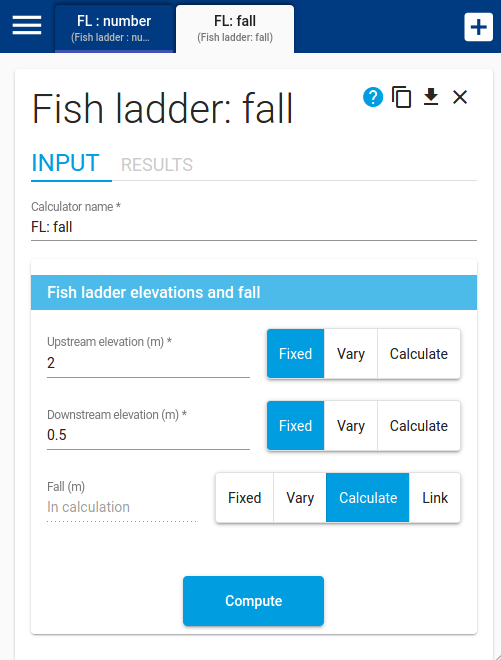
For each of them, the user can choose to:
- Set the parameter's value ("FIXED" button);
- Vary the parameter to perform a series of calculations ("VARIATED" button);
- Choose the parameter that will be calculated ("CALCULATE" button).
The interface is designed so that one and only one parameter is chosen for the calculation. Parameters that cannot be calculated do not have a "CALCULATE" button.
How to vary a parameter to perform a series of calculations
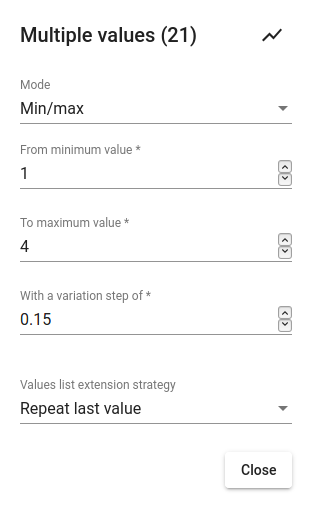
A series of calculations can be triggered between a minimum value and a maximum value for a given step:
Or for a list of defined values:
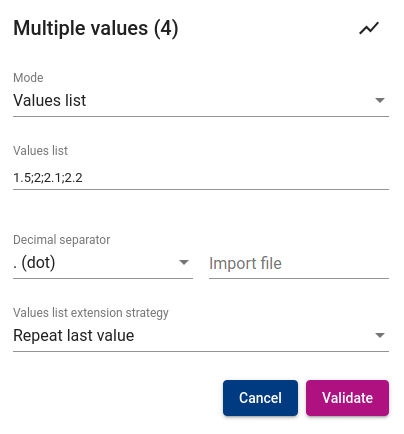
Importing a values list is done either by typing or copy/pasting it in the "Values list" field, or by importing a text file. The decimal separator is configurable. Any character outside the numeric characters, the letter "E" and the decimal separator will be considered as separator between the values. Therefore, the separator could be comma, semicolon, space, tabulation, new line...
The window title contains the corresponding number of occurrences. Clicking on the graphic logo at the right of the window title displays a chart of the parameter variations.
In case several parameters vary and they do not have the same number of occurrences, it is necessary to define a strategy to extend the shortest lists to fit the list of the parameter with the most occurrences. Two strategies are available: repeat the last value or reuse the values in the list since the first occurrence.
How to launch a calculation or a series of calculations
Press the [Enter] key or click on the "Calculate" button at the bottom of the page.
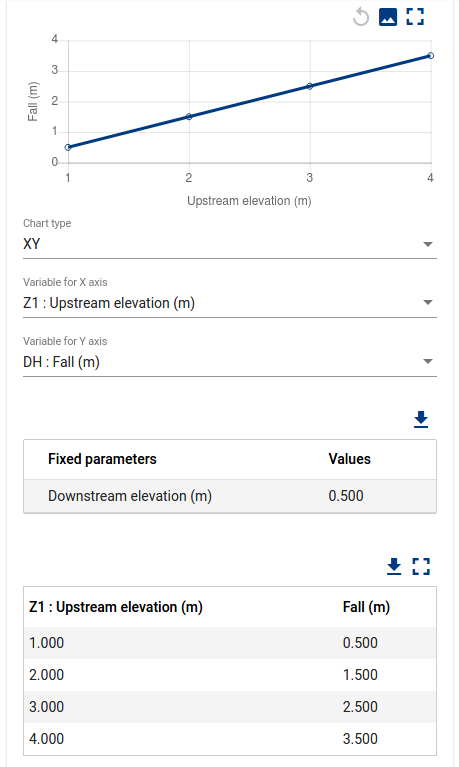
Calculation results
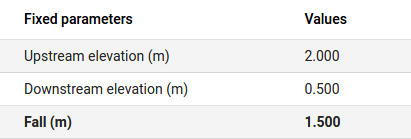
For fixed parameters, the results panel displays the fixed parameters and the calculated parameter as well as any additional results.
For one or more varying parameters, the results panel displays:
- an evolution graph on the which you can choose the parameter to use on the x-axis and y-axis;
- a table containing the parameters set;
- a table showing the parameters that vary and the calculated parameter as well as the values of any additional results.
The tables and charts are provided with different functionalities:
- a download button to retrieve the table content in XLSX format;
- a download button to retrieve the chart in PNG format;
- a button to display the table or chart in full screen.
The charts are zoomed in by making a mouse selection on some area. The button with the curved left-pointing arrow resets the zoom to its original position displaying all available values.